
Key signals from the BTC market may reveal the direction of the next major trend. On-chain metrics provide valuable insights into market structure and potential turning points.
The first critical level sits near 47,000 USD, corresponding to the True-Market Mean indicator. This is not a standard average - it is an advanced valuation model that accounts only for actively circulating supply, excluding coins that are lost or long-term dormant. In practice, it represents the "center of gravity" for bitcoin's market and a natural equilibrium point.
When the price trades above the True-Market Mean:
This level often acts as a natural support zone to which the market tends to return during corrections, serving as an important reference point for long-term investors.
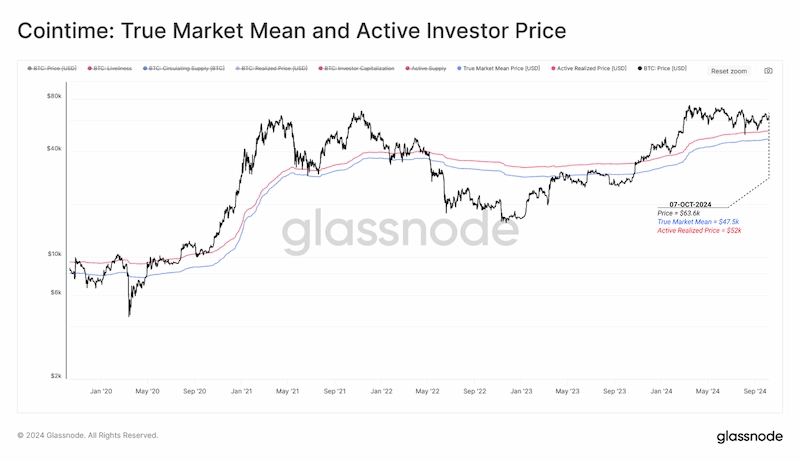
The second critical level is the Active Realized Price, currently around 52,500 USD. This metric reflects the average acquisition price of coins held by investors actively participating in the market.
Currently, bitcoin remains clearly above both levels, aside from a brief dip below the Active Realized Price during the August sell-off. This positioning is characteristic of a strong market supported by active demand and a diversified investor base.
Recent Glassnode reports highlight several additional indicators relevant to BTC's short-term and medium-term dynamics.
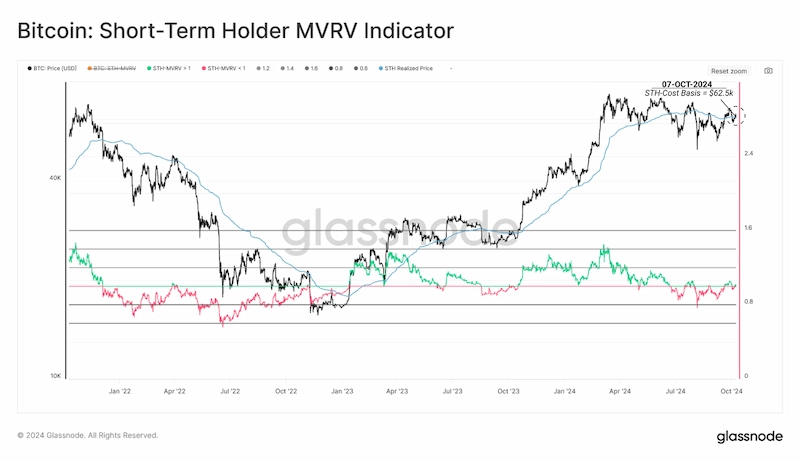
The average cost basis for short-term holders currently sits near 62,500 USD. This is an important reference point for market analysis because:
BTC is currently trading slightly above this threshold, supporting a constructive market outlook and suggesting stable demand.
Although long-term speculative positioning has eased, the futures market still shows a high level of open interest. A leveraged environment like this can amplify price volatility:
This is a factor investors should monitor closely, particularly during periods of elevated volatility.
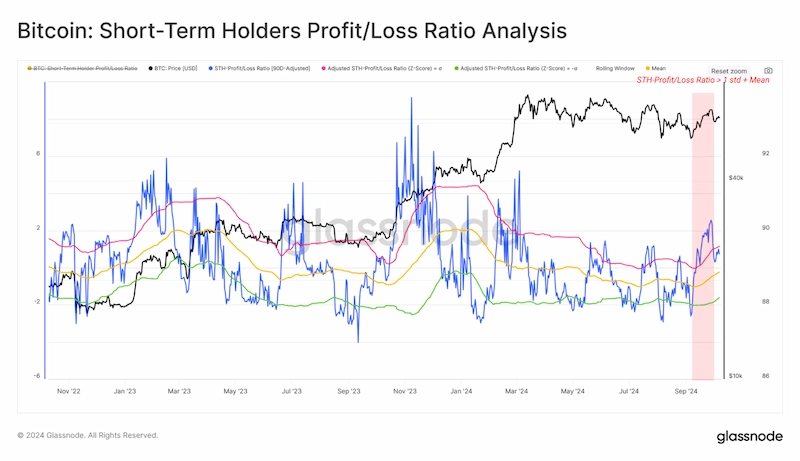
Glassnode also notes an uptick in profit-taking among short-term holders. While this can temporarily soften upward momentum, it is a natural component of a healthy market cycle and investment process.
The key question is whether new demand will absorb the selling pressure without a significant price decline.
Investor Implications: Bitcoin is currently trading near 62,500 USD. Despite moving within a slightly downward regression channel since the March highs, valuation models indicate that BTC remains in a structurally sound fundamental position. Sustaining levels above 47,000 USD, 52,500 USD, and 62,500 USD strengthens the case for continued bullish momentum. Investors should monitor these levels as critical support and resistance zones that may determine the price trajectory ahead.
Note: ARI10 communicates exclusively through official channels. Cryptoassets involve significant risk, including the potential loss of funds. Always verify information. For assistance, visit ari10.com.